


In recent years, the use of military burn pits has become one of the most widely discussed concerns about both current service members and veterans’ health
In the post-9/11 era and during the war on terror, tens of thousands of United States (U.S.) service members were stationed at bases around Iraq and Afghanistan. Commanders of these bases were faced with the daunting task of destroying waste generated during the operations of these bases. The most expedient method for disposal of waste, regardless of how hazardous the waste, was deemed to be open-air pit burning.
Military personnel were exposed to smoldering, toxic burn pits
Hundreds of open-air garbage dumps were spread across Afghanistan and Iraq, often close to encampments where American soldiers lived, worked, ate and slept. Everything considered to be waste was dumped into these pits to be burned. This included not only paper waste, plastics, electronics, Humvee parts and tires, but also biological waste ranging from innocuous junk food to wound dressings, amputated body parts, and human waste, as well as lithium-ion batteries, hazardous chemicals and munitions. To provide a perspective of the volume of material burned, more than 864,000 bottles of water were consumed each month at one forward operating base in Iraq in the 2000s, with that number doubling during the hotter months. These and other discarded items were soaked in JP-8 jet fuel and set on fire.
The pits burned or, more accurately smoldered, day and night seven days a week. Based on the amount of waste generated, the size of the pits ranged from small pits created by patrol units to huge pits located on industrial-sized facilities that covered more than 10 acres. One base, Joint Base Balad in Iraq, burned more than 200 tons of trash every day. Depending on the prevailing winds, the smoke and ash often settled across the housing areas where the soldiers lived. One solder described the smoke as “thick like San Francisco fog”. The colour of the smoke changed depending on what was burning that day, but mostly it was black.
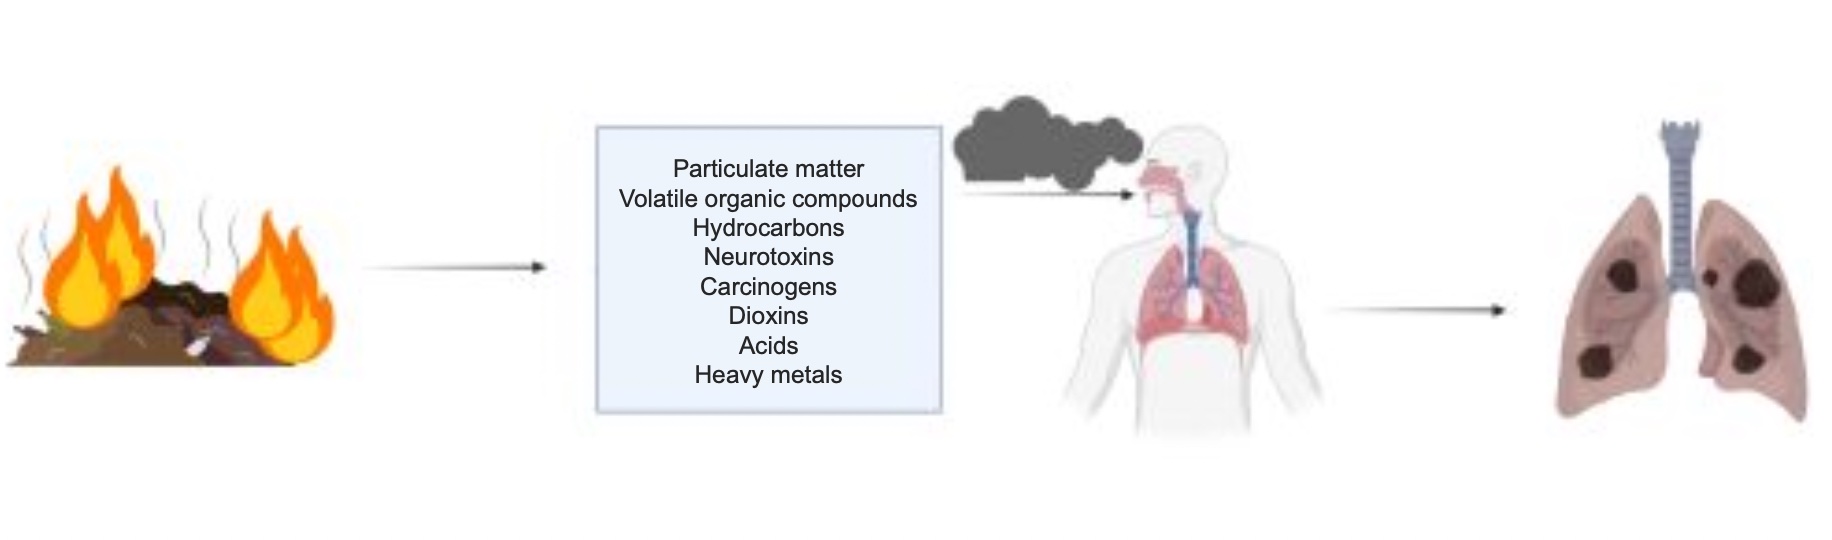
Much of the waste in the pits was toxic, and when burned, it released a plume of pollutants that included particulate matter, volatile organic compounds, hydrocarbons, and neurotoxins. The jet fuel used to ignite fires released benzene, a known carcinogen. Hazardous levels of copper, iron and titanium have since been found in soil samples from several of the bases. Burning plastics released dioxin, hydrochloric acid and other carcinogens.
Soldiers and civilians became sick
Very early during the military occupation, soldiers that served near burn pits reported a complex array of symptoms. These included respiratory issues, such as asthma, sinusitis, bronchitis, and/or persistent coughing. Many began to cough up black mucus that they called “plume crud” or “black goop”. Some suffered from severe chronic respiratory disease, including constrictive bronchiolitis, a typically rare and often fatal lung disorder for which there is no cure. Other symptoms included unexplained diarrhea, severe headaches, weeping lesions on the extremities and chronic infections.
Civilians were also exposed because burn pit emissions were carried to surrounding areas by the wind. Environmental sampling of the air and soil near burn pits confirmed the presence of several chemical compounds known to cause inflammation and tissue damage, particularly in the respiratory tract. Farmers who lived downwind noticed an increased incidence of birth defects and fertility issues in their livestock. Children reported symptoms such as dizziness and balance problems.
As early as 2003, soldiers were returning from deployment in Afghanistan and Iraq complaining of shortness of breath. Asthma is an excluding factor for military service, so these conditions arose while the soldiers were in the military. Conventional medical tests, such as lung imaging and pulmonary function tests, were performed on a group of soldiers in the 101st Airborne Division and nearly all the tests were normal. However, more than 50 of these soldiers were referred to Dr. Robert Miller, associate professor of allergy, pulmonary and critical care medicine at Vanderbilt University Medical Center. Dr. Miller made the unconventional recommendation of surgical lung biopsies. All but a few of the biopsied soldiers received pathology reports diagnosing constrictive bronchiolitis, a narrowing of the smallest and deepest airways in the lungs. It is an irreversible, chronic condition and currently can only be diagnosed through biopsy. Other advanced imaging modalities have found carbonaceous particles, polycyclic hydrocarbons, metals, oxidized metals and even partially combusted jet fuel in the lungs of veterans serving near burn pits.
Increasing numbers of military veterans from the post-9/11 era have developed lung, brain, bone, skin, and blood cancers. The U.S. Department of Defense (DOD) has estimated that nearly 3.5 million soldiers may have been exposed to toxic agents in smoke from the burn pits at levels sufficient to cause significant adverse health effects. Most of these soldiers only had short-term acute exposure to burn pit emissions while at peak health, whereas Iraqi citizens, at all life stages, were chronically exposed for 10 years. There have been multiple cases of brain cancer reported amongst Iraqi citizens living near and around burn pits.
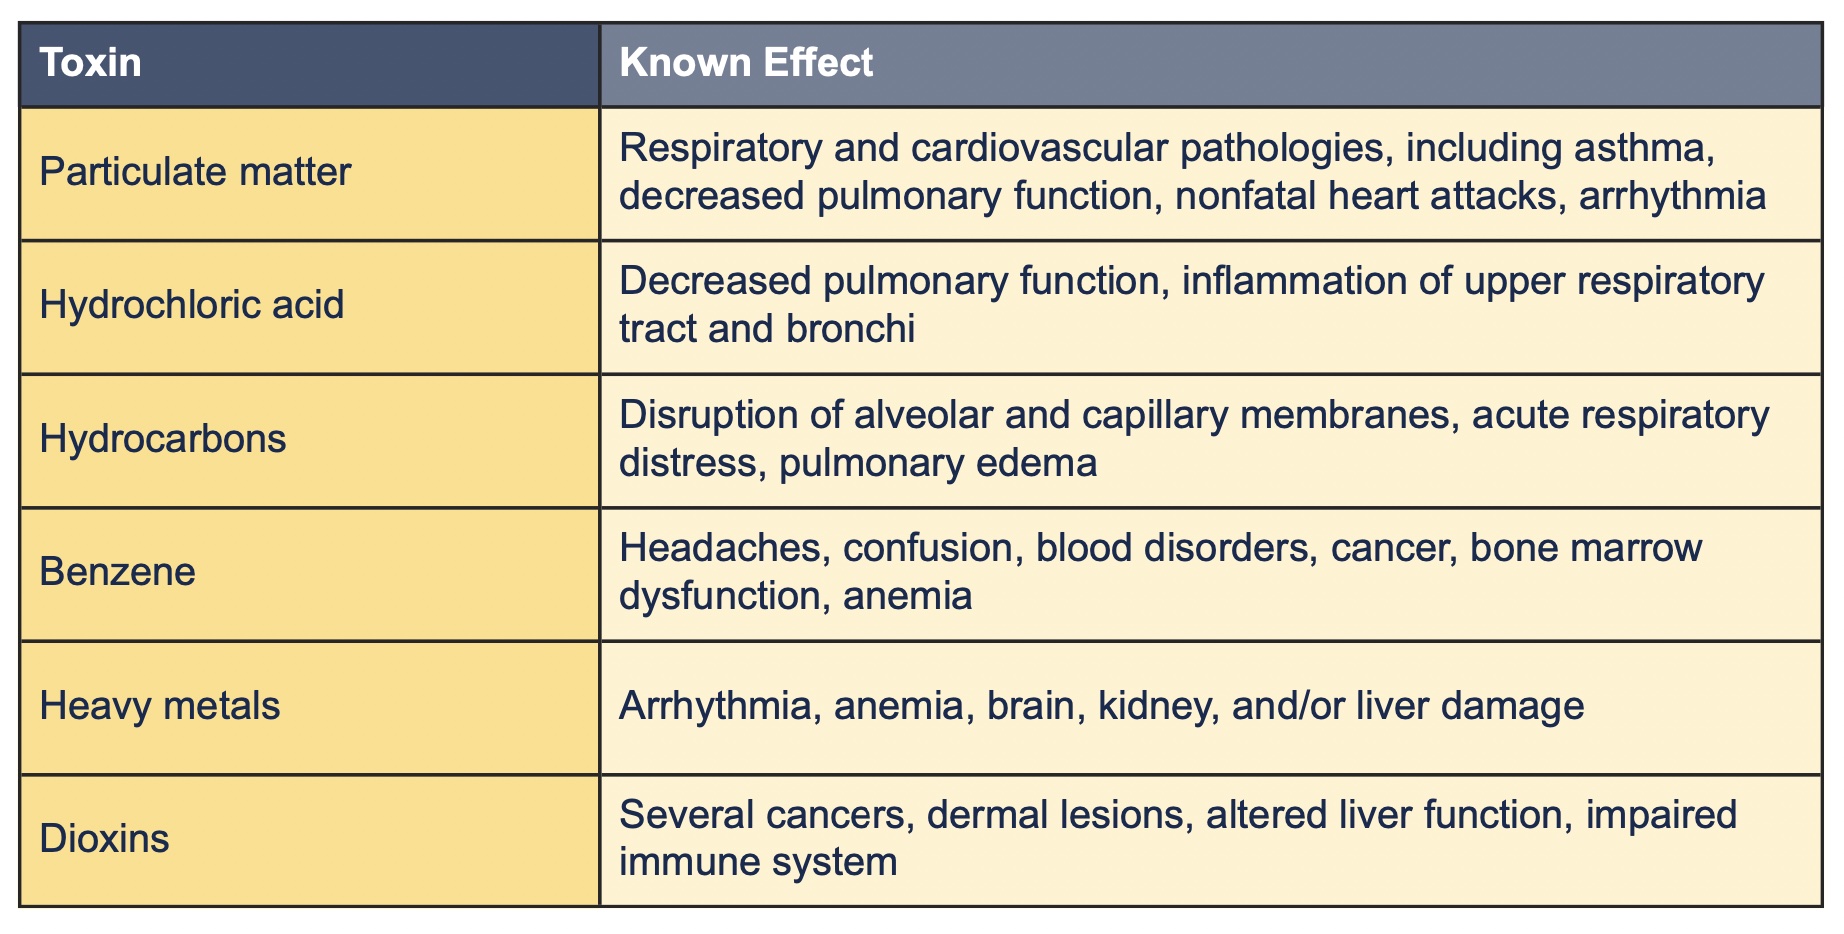
Because the DOD did not keep clear records of what was burned in the waste pits, the exact toxic agents in the smoke remain unknown. During the time pits were widely used, individual service members were not monitored for their exposure to the smoke. In addition to the toxic materials released from the burn pits, troops were exposed to a host of other environmental hazards, such as the dust from sandstorms, fuel and exhaust fumes, and depleted uranium from munitions. The complexity of these exposures has made it exceedingly challenging to connect specific medical diagnoses to exposure of smoke from these burn pits. While the exact composition of what was in every pit is unknown, it is known what types of toxic agents were generated in most burn pits, and many of these are associated with adverse health outcomes (Table 1).
The incinerator fiasco
Ironically, the burn pits were supposed to be a temporary solution to waste disposal. However, the burn pits were built and run by Kellogg, Brown and Root (KBR), a subsidiary of Halliburton, a company involved in several controversies during the Iraq war. KBR operated the burn pits as part of a $ 35 billion logistics contract in Afghanistan and Iraq. Several burn pits were constructed on the ruins of former Iraqi bases that stockpiled chemical weapons (mustard and sarin gas) from Saddam Hussein’s regime and were destroyed during the U.S. bombardment of Iraq. According to military sources involved with the construction of these pits, KBR did not take any soil samples during the construction of these pits despite the fact that the area was known to be contaminated from chemical weapon destruction. Many veterans who served at these former Iraqi chemical weapons bases are now showing signs of mustard gas exposure.

For seven years, the nearly 500 documented burn pits in the Middle East theater of operation (Afghanistan, Iraq and Kuwait) went completely unregulated, seemingly exempt from all government oversight. A 2006 Air Force memo describing a burn pit in Iraq states: “the worst environmental site I have personally visited… It is amazing that the burn pit has been able to operate without restrictions over the past few years.” The memo recommended the use of incinerators instead.
In 2004, the DOD ordered 41 incinerators be installed across Iraq and Afghanistan that were designed to burn at much higher temperatures and in a much more controlled fashion than the burn pits, thus, producing much less air pollution. The U.S. military spent more than $ 81 million to install 23 incinerator systems at nine military installations in Afghanistan to dispose of its mounds of trash. However, many of the incinerators were defective or never reached operational status.
In numerous instances, the DOD did not take sufficient steps to ensure the proper management of the construction contracts or consider incinerator practicality. Technical issues plagued the incinerations; for example, some were constructed with loading hoppers that were too small to allow forklifts to load waste into the incinerator. An audit by the Special Inspector General for Afghanistan Reconstruction (SIGAR) found that the U.S. Corps of Engineers paid more than $ 5.4 million dollars for two facilities despite that fact that the contractor was 30 months behind schedule and the incinerators had known construction deficits and were not tested prior to being installed. A safety inspection after installation found multiple electrical deficiencies that would cost at least an additional $ 1 million to repair. These repair and additional operation costs led base commanders to abandon the incinerators all together and continue open pit burning.
The Veterans Administration (VA) has resisted calls to link many rare illnesses to suspected burn pit exposure, stating that the scientific backing for the argument is too weak, despite more than a decade of research into the health effects of exposure to contaminants generated by burn pits. Advocates say this decision has deprived tens of thousands of veterans of legitimate disability pay and medical benefits. They argue that for veterans exposed to toxic smoke from the burn pits in Irag and Afghanistan, the federal response to the problem is too slow, too incomplete, and unfortunately, too late for the thousands of troops that have succumbed to fatal diseases. The VA has denied roughly 75 percent of veteran’s claims for disability benefits, downplaying the connection between the massive burn pits and the growing number of people falling ill. The VA required veterans to supply evidence proving that their health condition was caused by their military service. This is often a lengthy or impossible task.
As a result, numerous lawsuits have been filed by or on behalf of veterans.
More recently, due to pressure from advocates for soldiers exposed to burn pits, the VA reviewed data regarding the toxic exposures associated with the burn pits. In 2014, the VA established the Airborne Hazards and Open Burn Pit Registry (AHOBPR) to register veteran’s service locations and potential exposures with the aim of helping veterans and researchers better understand the potential effects of airborne exposures. Unfortunately, the registry enrollment is notoriously difficult to complete. VA documents indicate that 38% of people who accessed the registry never started the questionnaire and 37% did not complete it beyond the deployment section. Of those who have registered, 72% reported neurological problems; 40%, allergies; 37%, hypertension; 19%, immune system issues; 14%, asthma; and 13%, chronic bronchitis. Only 10% of people who requested a physical examination after completing the registry received one. It is unclear if this due to reluctance on the part of the soldiers or inadequacy of the VA system.
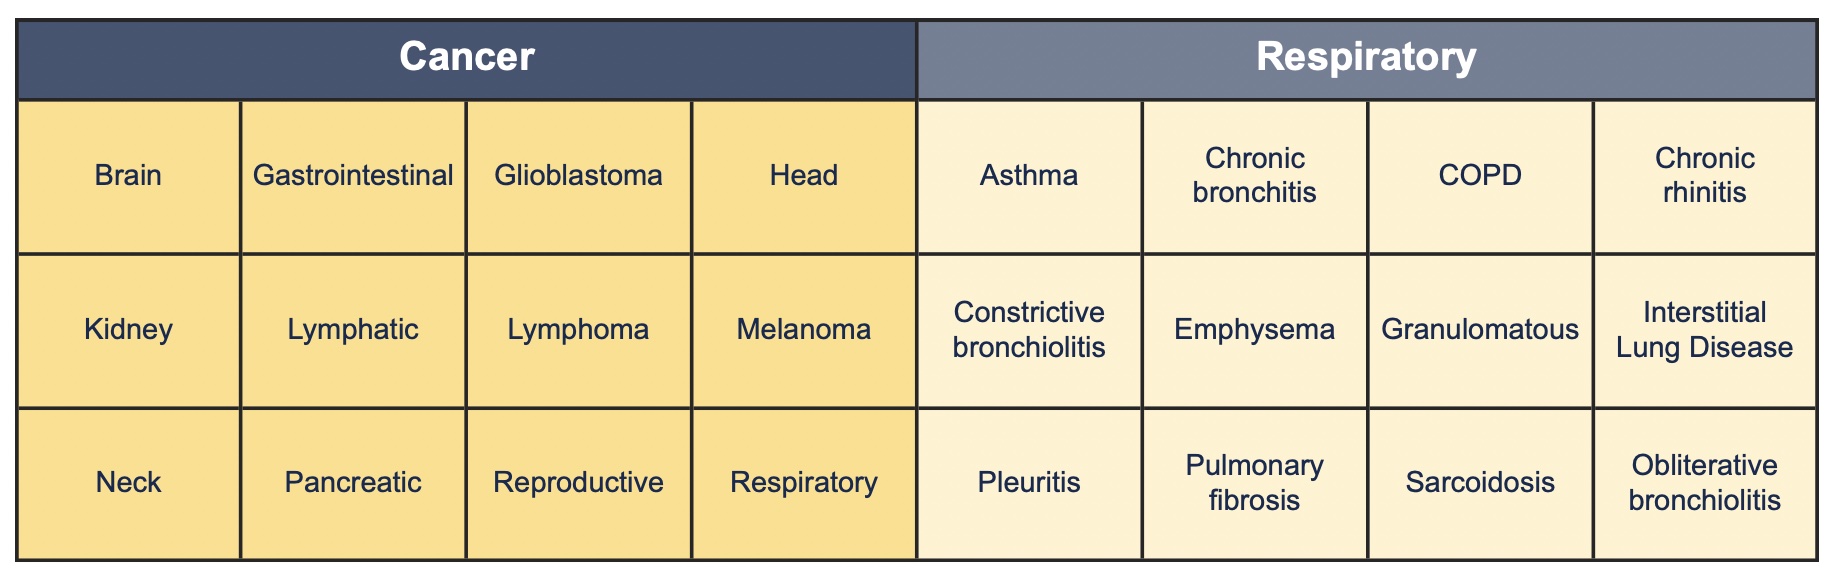
In August 2021, burn pits received their own presumptive disease list. The VA finally determined that there was enough scientific evidence to associate three respiratory conditions – rhinitis, sinusitis, and asthma – with inhalation of airborne particulate matter from burn pits. In addition to these respiratory conditions, rare cancers have been diagnosed among veterans. U.S. President Biden issued an order on November 11, 2021, requiring the VA to review the research and determine whether burn pits were associated with the development of these rare cancers and report back in 90 days. After review, the VA stated that they have “determined through a focused review of scientific and medical evidence that there is a biological plausibility that airborne hazards are associated with carcinogenesis of the respiratory tract.” They also stated that the “unique circumstances of these rare cancers warrant a presumption of service connection.” As a result of these findings, the VA added nine types of respiratory cancer to the presumptive disease list associated with exposure to burn pits (Table 2).
This is a step in the right direction that facilitates veteran access to medical care following exposure to toxic smoke from burn pits. Now service members only need to provide a diagnosis of the conditions and the dates and locations of their service to be eligible for treatment. However, there are many other cancers and medical conditions linked to burn pits that are not on the presumptive disease list, including functional deficits of the nervous system, liver and kidney, eczema and dermal lesions, cardiovascular dysfunction, autoimmune disorders, migraines and infertility.
Unregulated burn pits are still active in the U.S.
Unfortunately, overseas bases are not the only place where the DOD has burned hazardous waste in the open air, and veterans are not the only ones reporting health problems. There are at least 61 active open burn sites in the U.S. today. These are mostly in rural, low-income areas. While the materials destroyed in the open burning and detonation sites in the U.S. are not identical, they do produce many of the same harmful emissions: acidic gases, toxic metals, dioxins, furans, volatile organic compounds, fine particulate matter, and polychlorinated biphenyls, or PCBs.
Most of the current sites, which burn or detonate waste into the open air, are run by the military or its contractors, according to the Pentagon and the U.S. Environmental Protection Agency (EPA). For example, the Radford Army Ammunition Plant (RAAP) in Virginia, which supplies explosives for almost every bullet made in the U.S., is allowed to burn up to 2.9 million pounds of waste every year. The EPA has found RAAP in violation of its hazardous waste permits at least 50 times in the past 37 years for reasons such as mishandling or mischaracterizing its explosive waste and improperly monitoring groundwater.
In 2020, RAAP reported the release of over 10 million pounds of pollutants. This is more than the next four largest polluters in Virginia combined. Open burning is known to pollute the air and damage the soil, groundwater and surface water. In particular, open burning at RAAP is associated with emissions of heavy metals (including lead, arsenic, cadmium and chromium), volatile organic compounds (including benzene, methylene chloride and toluene) and dioxins/furans. Exposure to heavy metals can damage various organ systems, resulting in gastrointestinal, kidney and immune system dysfunction, nervous system disorders, vascular damage, birth defects and cancer. Benzene is a known carcinogen that can cause leukemia and negatively impact the immune system. Dioxins/furans are known as persistent organic pollutants due to their ability to bioaccumulate in the ecosystem and in the human body because they are chemically stable and are absorbed by fatty tissue. They also adversely impact numerous organs and body systems.
The RAAP open burn sites continue to operate due to outdated exemptions in EPA regulations. The EPA outlawed open burning or detonation of hazardous materials in 1980 but allowed the military sites to operate open burn facilities until “a more suitable method could be developed to dispose of these wastes”. The open burning and detonation have continued unabated with little change in regulation for the last 40 years. The EPA’s method for determining what and how much can be burned is little more than an educated guess. The limits are established based on modeling of highly speculative parameters that bear little resemblance to the day-to-day reality of refuse burned by RAAP. In the first 70 years that operators burned waste at RAAP, neither the Army, the EPA, nor the state of Virginia ever measured the air pollutants coming from the burn pads or took samples in the nearby communities. Now researchers rank the air in Radford as some of the most dangerous in the country. This is particularly concerning because the Radford site is located within 10 kilometers of 23 sensitive sites, including schools, daycare centers, hospitals, and nursing homes. Nearby Belview Elementary School has been ranked by researchers as facing some of the most dangerous air quality hazards in the country. The rate of thyroid diseases in three of the surrounding counties is among the highest in the state of Virginia.
In addition to the 61 active U.S. burn sites, there are hundreds more that have been closed or converted to other uses. Many active and inactive burn sites have not been properly decontaminated and are considered Superfund cleanup sites. Superfund sites are severely polluted locations within the U.S. that require a long-term and often expensive clean-up to decontaminate the affected area. The EPA estimates that there are between 35 to 54 open burn sites that may qualify as Superfund sites, and half of those are still active.
While legislators are taking steps towards aiding veterans in their recovery post exposure, there is still very little being done to regulate what goes into active burn pits, how they are monitored and tested, or where they are located. Until these problems are addressed, it will be difficult to understand the magnitude of damage caused by burn pits to soldiers and civilians, which ultimately exacts a more significant toll than the cost of disposing of wastes via safer methods than open burning.
Read and download the full eBook “Military burn pits: A toxic legacy of war” here
More About Stakeholder
-
 UC Davis Department of Molecular Biosciences
The Department of Molecular Biosciences serves as the academic home for all nutritional, physiological chemistry, and pharmacologic and toxicologic programs of the School of Veterinary Medicine at UC Davis. The goal of the Department of Molecular Biosciences is to study fundamental biological processes and their perturbations by mutations, nutrition, drugs and xenobiotics and the application […]


 Access Rights | Content Availability:


 APU Content Aggregation Service