...
...
Photodynamic Therapy: Killing cancer gently with visible light

...

Photodynamic Therapy: Killing cancer gently with visible light

Posted | Updated by Insights team:

Publication | Update:

May 2023
...

Photomicrograph of Metastatic adenocarcinoma of lung. Pleural fluid FNAC. 200X
Image: © Md Saiful Islam Khan | iStock

Photodynamic therapy, using visible light with lower energy, causes fewer side effects when treating cancer, find Drs. Mary Potasek, Evgueni Parilov, and Karl Beeson, Co-founders of Simphotek, Inc

You are probably familiar with x-ray radiation therapy for treating cancer. But do you know that x-rays are ionizing radiation that can cause damage to many tissues besides killing cancer cells? Simphotek and others are using near-infrared or “gentle” visible light whose wavelength is longer than x-rays and with much lower energy so that it causes fewer side effects.

The novel therapeutic modality known as Photodynamic Therapy (PDT) can do just this. PDT does not cause nausea as chemotherapy does, does not damage ordinary tissue as x-ray radiation does, nor does it require removing or damaging parts of the body as surgery does.

A new approach for killing cancer with light: photodynamic therapy

PDT uses light (usually provided by a laser), a light-sensitive drug and molecular oxygen to trigger multiple cascading events that generate a cytotoxic agent, singlet oxygen, that kills cancer cells. There are various forms of PDT treatment including External Beam or surface (EB-PDT), Intracavity or intraoperative (icavPDT), and interstitial (I-PDT). The first method is used mainly for skin conditions and cancers where the drug is applied superficially, and the treated area is exposed to light. The icav-PDT is usually performed after a surgical procedure, such as lung surgery, where a cavity is either present or formed by the surgery.

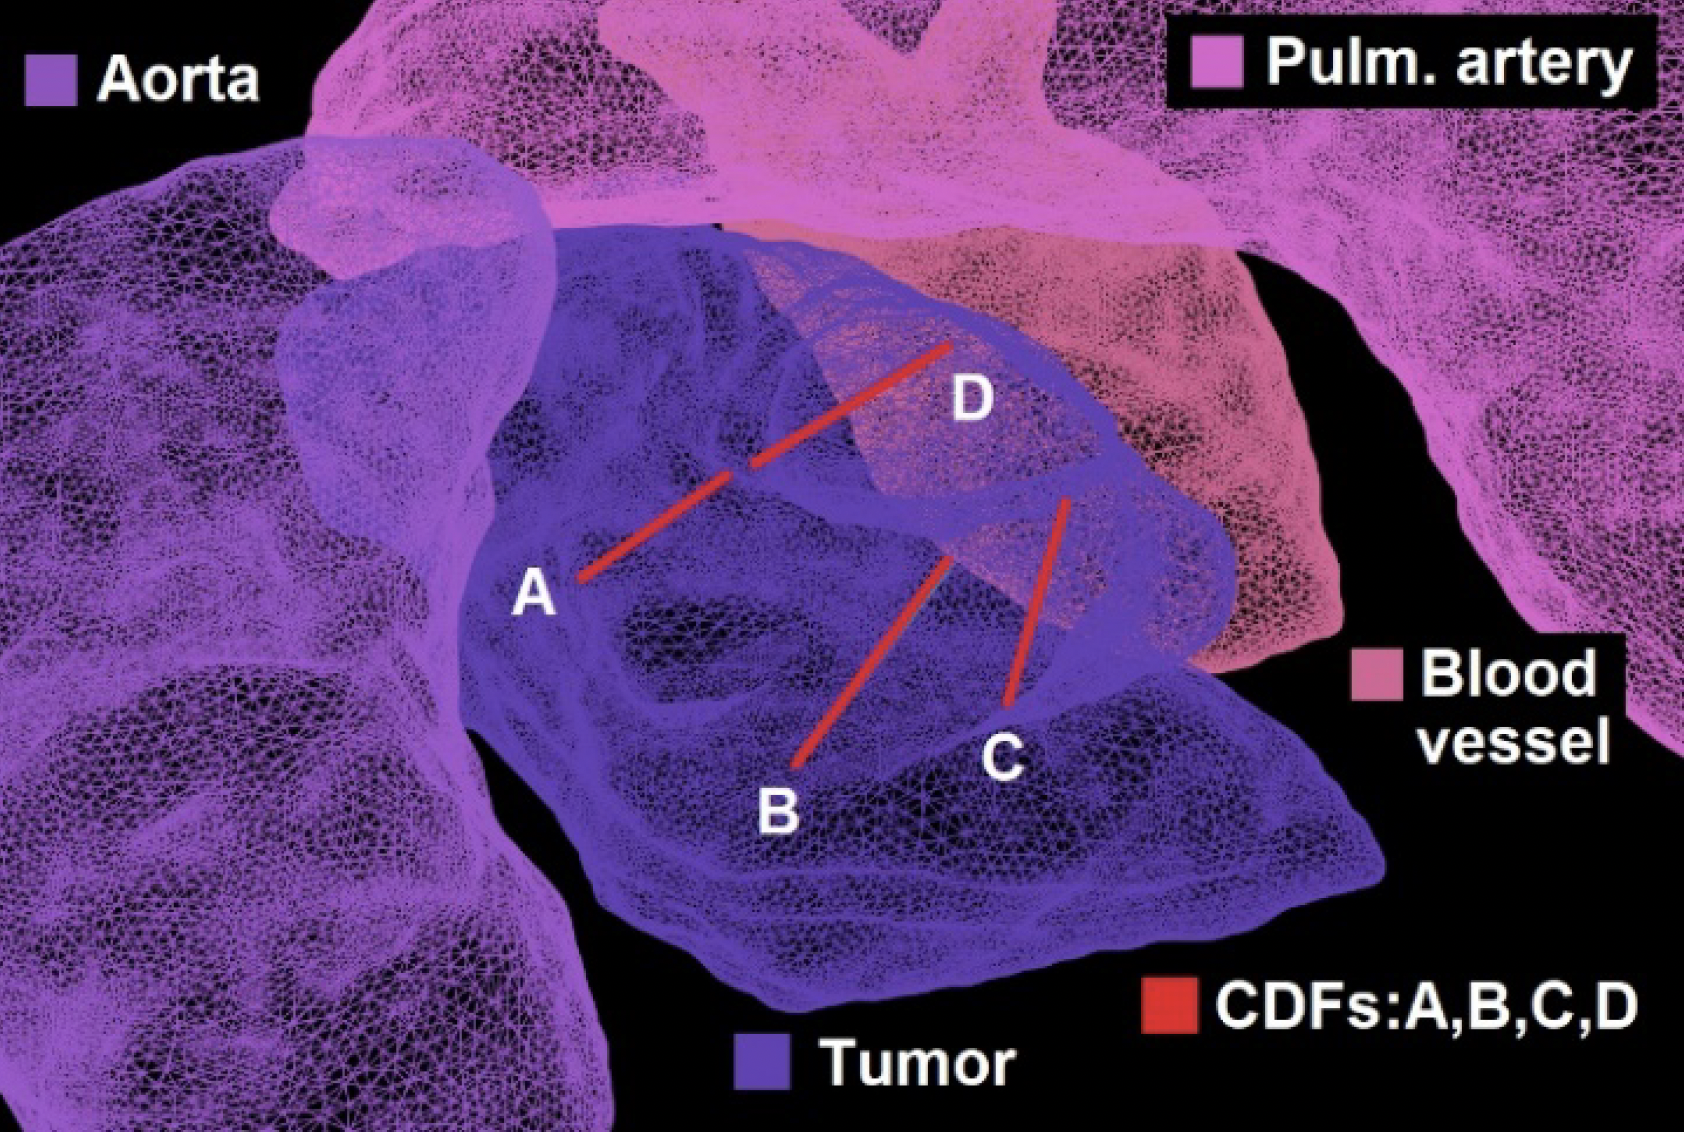
A photosensitive drug is administered into the body and is “activated” by the treatment laser light. I-PDT is used to treat solid cancers that are deeper in the body, such as the brain, esophagus, bladder, head and neck, cholangiocarcinoma, lung, and prostate. Light travels only a few millimeters in tissue so another mechanism must be added for successful treatment. These treatments use cylindrical diffusing optical fibers that tunnel the light from external lasers directly into the tumors and uniformly distribute it in the cancerous areas.

The amount of the delivered visible light matters

The amount of the delivered visible light matters, as it should be above a therapeutic threshold established by previous and current clinical trials. Because it is practically impossible to perform measurements everywhere inside the tumor to make sure that the light dose is delivered correctly, computer simulations based on advanced mathematical models of light propagation in human tissue are performed before the treatment starts. The EB-PDT can be done without extensive mathematical simulations, but the last two types of photodynamic therapy require advanced mathematical simulations to determine if the prescribed amount of light is delivered to various sections of the tumor, such that it is sufficient to kill cancer cells.

Simphotek has been supported by the United States National Institute of Health (NIH) to create such a simulation research tool for solid cancers and it’s called Dosie™.

Simulating Cancer Treatment with Dosie

There are several simulation methods that can model certain aspects of the photodynamic therapy process, but they do not cover everything that is needed for complete cancer treatment simulation. To the best of our knowledge, Dosie is the first comprehensive tool to simulate the PDT process including the light transport, drug, and molecular oxygen interactions to create the cytotoxic agent, singlet oxygen, which kills cancer. Treating cancer is complex and just as for radiation therapy, it requires advanced computer simulations.

Treating cancer with light requires advanced computer simulations

Starting with a CT scan or MRI of the tumor, a detailed 3D model of the tumor and its surroundings is created. Using state-of-the-art 3D graphics, Dosie can guide the physician in near real-time during the icav-PDT or I-PDT treatment to visualize the portion of the tumor that receives a therapeutic visible light dose to ensure a uniform light delivery. One of the benefits of using Dosie is its ability to estimate not only the conventional light dose but also the state-of-the-art PDT dose (that includes the variation of the drug concentration in the tumor) and singlet-oxygen dose (that estimates the amount of the cancer-killing agent and its distribution). The most common type of PDT is EB-PDT, which is responsible for most of the global PDT market. The total market is anticipated to reach more than USD 15.1 Billion by the end of 2031 and is projected to advance at a CAGR of 13.5% from 2022 to 2031 (1).

Dosie Screen Shot of MCAO-Red lines are fibers

North America is expected to dominate the photodynamic therapy market, due to a high rate of adoption and new product launches by market players (2). Simphotek and its academic collaborators have treated a number of different cancers but the most recent one is non- small cell lung cancer that manifests itself as an endobronchial tumor growth near or inside the airway. Unfortunately, the tumor can become large enough to block the bronchus and in doing so it also becomes intertwined with several other tissues including blood vessels. The mixture of different tissues makes treatment planning difficult.

North America is expected to dominate the photodynamic therapy market, due to a high rate of adoption and new product launches by market players (2). Simphotek and its academic collaborators have treated a number of different cancers but the most recent one is non- small cell lung cancer that manifests itself as an endobronchial tumor growth near or inside the airway. Unfortunately, the tumor can become large enough to block the bronchus and in doing so it also becomes intertwined with several other tissues including blood vessels. The mixture of different tissues makes treatment planning difficult.

Image Guided I-PDT Treatment for MCAO

Malignant central airway obstruction (MCAO) is becoming a serious problem for patients with lung cancer. Lung cancer is the most common cancer and the leading cause of death in both men and women (3). The American Cancer Society estimates that for 2023 there will be about 238,340 cases of lung cancer (67,160 in men and 59.910 in women) in the United States (3).

Global lung cancer market revenue was worth USD 21.1 billion in 2021, growing to USD 67.9 billion by 2030 with a 14.1% CAGR from 2022 to 2030. North America has dominated with more than 35.5% of lung cancer market share in 2021 (4). Lung cancer is often treated by radiation and chemotherapy both of which can lead to damaging effects on non-cancerous tissue. Applying PDT does not result in these tissue- damaging problems. In addition, PDT is one therapeutic option for inoperable lung cancer where other options have been exhausted (5). A growing problem for lung cancer patients is airway obstructions that can manifest as intrinsic (endobronchial tumor growth), extrinsic (extrabronchial tumor compression), or mixed obstructions.

A potential to improve tumor response and survival

At present, additional treatment options and numerous hospital visits are needed to treat these patients and to improve the tumor response and survival. In contrast, endobronchial obstructions have several treatment options including surgery or heat treatments followed by airway stenting. Therapeutic options for endo/extrabronchial (mixed) tumors are currently limited and treated with stents following balloon dilation. Along with the development of interventional pulmonology, photodynamic therapy is being used in the treatment of respiratory malignant tumors because of its low level of trauma, high specificity, and compatibility with traditional or common therapies (5). Simphotek and its academic collaborators are engaged in a Phase I/IIa (NCT03735095) clinical trial to treat MCAO.

This therapy is becoming more common due to advanced primary lung cancer (6). In this trial, to treat MCAO an ultrasound system (Endobronchial Ultrasound, EBUS) is used that images the tumor and guides fiber insertions into the tumor to treat it with I-PDT. Prior to treatment a CT scan of the chest is obtained to identify the airway, the tumor, and the amount of blockage that may be present.

This is imported into Dosie by the study team to simulate treatment.

The results of simulations help to determine specific parameters for the treatment: the laser and diffusing fiber configurations. The goal is to treat the tumor’s greatest volume with the least exposure to the major blood vessels or other sensitive areas. We hope that this clinical trial will bring us one step closer to our aim of treating patients as safely and effectively as possible.

We have described a novel light-based method to treat solid cancers with fewer side effects than traditional methods.

References

  1. www.transparencymarketresearch.com
  2. www.mordorintelligence.com
  3. www.cancer.org
  4. www.globenewswire.com
  5. F. Jin, H.Wang, Q. Li, C. Bai, Y. Zeng, G. Lai, S. Guo, X. Gu, W. Li, H. Zhang, “Critical application of photodynamic therapy for malignant airway tumors in China”, Thorac. Cancer.2020;11(1):181–19
  6. https://amj.amegroups.com
Please Note: This is a Commercial Profile

Contributor Profile

Dr, Co-Founder
Simphotek, Inc
Phone:+1 973-621-2340
Website: Visit Website
Facebook: Follow on Facebook

Contributor Profile

Dr, Co-Founder
Simphotek, Inc
Phone:+1 973-621-2340
Website: Visit Website
Facebook: Follow on Facebook

Contributor Profile

Dr
Simphotek, Inc
Phone: +1 973-621-2340
Website: Visit Website
Facebook: Follow on Facebook

...
Framed Content Aggregator - Publisher | Sponsor
...
OPEN ACCESS GOVERNMENT

Open Access Government is a digital publication that provides an in-depth perspective on key public policy areas from all around the world, including health and social care, research and innovation, technology, blockchain innovation, government, environment and energy. https://www.openaccessgovernment.org/

SKU code : E5F215D3-DE56-4EF1-3907-A04C4B5849FA
Delivery Format:
HTML ...

Immediate Delivery
...Access Rights | Content Availability:
...

...

The content of this subscriber knowledge library area, the technology platform and tools are provided for information purposes only. No legal liability or other responsibility is accepted for any errors, omissions, or any loss, damage or inconvenience caused as a result of reliance on such information, or statements on this site, or any site to which these pages connect, since we cannot control the content or take responsibility for pages maintained by external providers. Where we provide links to sites, we do not by doing so endorse any information or opinions appearing in them. This courseware includes resources copyrighted and open educational resources (OER) by multiple individuals and organizations. If someone else is given access to your account login information, that person has read, understands and accepts the Conditions of Use for this platform.

...

Objectives and Study Scope

This study has assimilated knowledge and insight from business and subject-matter experts, and from a broad spectrum of market initiatives. Building on this research, the objectives of this market research report is to provide actionable intelligence on opportunities alongside the market size of various segments, as well as fact-based information on key factors influencing the market- growth drivers, industry-specific challenges and other critical issues in terms of detailed analysis and impact.

The report in its entirety provides a comprehensive overview of the current global condition, as well as notable opportunities and challenges. The analysis reflects market size, latest trends, growth drivers, threats, opportunities, as well as key market segments. The study addresses market dynamics in several geographic segments along with market analysis for the current market environment and future scenario over the forecast period. The report also segments the market into various categories based on the product, end user, application, type, and region.
The report also studies various growth drivers and restraints impacting the  market, plus a comprehensive market and vendor landscape in addition to a SWOT analysis of the key players.  This analysis also examines the competitive landscape within each market. Market factors are assessed by examining barriers to entry and market opportunities. Strategies adopted by key players including recent developments, new product launches, merger and acquisitions, and other insightful updates are provided.

Research Process & Methodology

...

We leverage extensive primary research, our contact database, knowledge of companies and industry relationships, patent and academic journal searches, and Institutes and University associate links to frame a strong visibility in the markets and technologies we cover.

We draw on available data sources and methods to profile developments. We use computerised data mining methods and analytical techniques, including cluster and regression modelling, to identify patterns from publicly available online information on enterprise web sites.
Historical, qualitative and quantitative information is obtained principally from confidential and proprietary sources, professional network, annual reports, investor relationship presentations, and expert interviews, about key factors, such as recent trends in industry performance and identify factors underlying those trends - drivers, restraints, opportunities, and challenges influencing the growth of the market, for both, the supply and demand sides.
In addition to our own desk research, various secondary sources, such as Hoovers, Dun & Bradstreet, Bloomberg BusinessWeek, Statista, are referred to identify key players in the industry, supply chain and market size, percentage shares, splits, and breakdowns into segments and subsegments with respect to individual growth trends, prospects, and contribution to the total market.

Research Portfolio Sources:

  • BBC Monitoring

  • BMI Research: Company Reports, Industry Reports, Special Reports, Industry Forecast Scenario

  • CIMB: Company Reports, Daily Market News, Economic Reports, Industry Reports, Strategy Reports, and Yearbooks

  • Dun & Bradstreet: Country Reports, Country Riskline Reports, Economic Indicators 5yr Forecast, and Industry Reports

  • EMIS: EMIS Insight and EMIS Dealwatch

  • Enerdata: Energy Data Set, Energy Market Report, Energy Prices, LNG Trade Data and World Refineries Data

  • Euromoney: China Law and Practice, Emerging Markets, International Tax Review, Latin Finance, Managing Intellectual Property, Petroleum Economist, Project Finance, and Euromoney Magazine

  • Euromonitor International: Industry Capsules, Local Company Profiles, Sector Capsules

  • Fitch Ratings: Criteria Reports, Outlook Report, Presale Report, Press Releases, Special Reports, Transition Default Study Report

  • FocusEconomics: Consensus Forecast Country Reports

  • Ken Research: Industry Reports, Regional Industry Reports and Global Industry Reports

  • MarketLine: Company Profiles and Industry Profiles

  • OECD: Economic Outlook, Economic Surveys, Energy Prices and Taxes, Main Economic Indicators, Main Science and Technology Indicators, National Accounts, Quarterly International Trade Statistics

  • Oxford Economics: Global Industry Forecasts, Country Economic Forecasts, Industry Forecast Data, and Monthly Industry Briefings

  • Progressive Digital Media: Industry Snapshots, News, Company Profiles, Energy Business Review

  • Project Syndicate: News Commentary

  • Technavio: Global Market Assessment Reports, Regional Market Assessment Reports, and Market Assessment Country Reports

  • The Economist Intelligence Unit: Country Summaries, Industry Briefings, Industry Reports and Industry Statistics

Global Business Reviews, Research Papers, Commentary & Strategy Reports

  • World Bank

  • World Trade Organization

  • The Financial Times

  • The Wall Street Journal

  • The Wall Street Transcript

  • Bloomberg

  • Standard & Poor’s Industry Surveys

  • Thomson Research

  • Thomson Street Events

  • Reuter 3000 Xtra

  • OneSource Business

  • Hoover’s

  • MGI

  • LSE

  • MIT

  • ERA

  • BBVA

  • IDC

  • IdExec

  • Moody’s

  • Factiva

  • Forrester Research

  • Computer Economics

  • Voice and Data

  • SIA / SSIR

  • Kiplinger Forecasts

  • Dialog PRO

  • LexisNexis

  • ISI Emerging Markets

  • McKinsey

  • Deloitte

  • Oliver Wyman

  • Faulkner Information Services

  • Accenture

  • Ipsos

  • Mintel

  • Statista

  • Bureau van Dijk’s Amadeus

  • EY

  • PwC

  • Berg Insight

  • ABI research

  • Pyramid Research

  • Gartner Group

  • Juniper Research

  • MarketsandMarkets

  • GSA

  • Frost and Sullivan Analysis

  • McKinsey Global Institute

  • European Mobile and Mobility Alliance

  • Open Europe

M&A and Risk Management | Regulation

  • Thomson Mergers & Acquisitions

  • MergerStat

  • Profound

  • DDAR

  • ISS Corporate Governance

  • BoardEx

  • Board Analyst

  • Securities Mosaic

  • Varonis

  • International Tax and Business Guides

  • CoreCompensation

  • CCH Research Network

...
Forecast methodology

The future outlook “forecast” is based on a set of statistical methods such as regression analysis, industry specific drivers as well as analyst evaluations, as well as analysis of the trends that influence economic outcomes and business decision making.
The Global Economic Model is covering the political environment, the macroeconomic environment, market opportunities, policy towards free enterprise and competition, policy towards foreign investment, foreign trade and exchange controls, taxes, financing, the labour market and infrastructure. We aim update our market forecast to include the latest market developments and trends.

Forecasts, Data modelling and indicator normalisation

Review of independent forecasts for the main macroeconomic variables by the following organizations provide a holistic overview of the range of alternative opinions:

  • Cambridge Econometrics (CE)

  • The Centre for Economic and Business Research (CEBR)

  • Experian Economics (EE)

  • Oxford Economics (OE)

As a result, the reported forecasts derive from different forecasters and may not represent the view of any one forecaster over the whole of the forecast period. These projections provide an indication of what is, in our view most likely to happen, not what it will definitely happen.

Short- and medium-term forecasts are based on a “demand-side” forecasting framework, under the assumption that supply adjusts to meet demand either directly through changes in output or through the depletion of inventories.
Long-term projections rely on a supply-side framework, in which output is determined by the availability of labour and capital equipment and the growth in productivity.
Long-term growth prospects, are impacted by factors including the workforce capabilities, the openness of the economy to trade, the legal framework, fiscal policy, the degree of government regulation.

Direct contribution to GDP
The method for calculating the direct contribution of an industry to GDP, is to measure its ‘gross value added’ (GVA); that is, to calculate the difference between the industry’s total pre­tax revenue and its total bought­in costs (costs excluding wages and salaries).

Forecasts of GDP growth: GDP = CN+IN+GS+NEX

GDP growth estimates take into account:

  • Consumption, expressed as a function of income, wealth, prices and interest rates;

  • Investment as a function of the return on capital and changes in capacity utilization; Government spending as a function of intervention initiatives and state of the economy;

  • Net exports as a function of global economic conditions.

CLICK BELOW TO LEARN MORE
...

Market Quantification
All relevant markets are quantified utilizing revenue figures for the forecast period. The Compound Annual Growth Rate (CAGR) within each segment is used to measure growth and to extrapolate data when figures are not publicly available.

Revenues

Our market segments reflect major categories and subcategories of the global market, followed by an analysis of statistical data covering national spending and international trade relations and patterns. Market values reflect revenues paid by the final customer / end user to vendors and service providers either directly or through distribution channels, excluding VAT. Local currencies are converted to USD using the yearly average exchange rates of local currencies to the USD for the respective year as provided by the IMF World Economic Outlook Database.

Industry Life Cycle Market Phase

Market phase is determined using factors in the Industry Life Cycle model. The adapted market phase definitions are as follows:

  • Nascent: New market need not yet determined; growth begins increasing toward end of cycle

  • Growth: Growth trajectory picks up; high growth rates

  • Mature: Typically fewer firms than growth phase, as dominant solutions continue to capture the majority of market share and market consolidation occurs, displaying lower growth rates that are typically on par with the general economy

  • Decline: Further market consolidation, rapidly declining growth rates

...

The Global Economic Model
The Global Economic Model brings together macroeconomic and sectoral forecasts for quantifying the key relationships.

The model is a hybrid statistical model that uses macroeconomic variables and inter-industry linkages to forecast sectoral output. The model is used to forecast not just output, but prices, wages, employment and investment. The principal variables driving the industry model are the components of final demand, which directly or indirectly determine the demand facing each industry. However, other macroeconomic assumptions — in particular exchange rates, as well as world commodity prices — also enter into the equation, as well as other industry specific factors that have been or are expected to impact.

  • Vector Auto Regression (VAR) statistical models capturing the linear interdependencies among multiple time series, are best used for short-term forecasting, whereby shocks to demand will generate economic cycles that can be influenced by fiscal and monetary policy.

  • Dynamic-Stochastic Equilibrium (DSE) models replicate the behaviour of the economy by analyzing the interaction of economic variables, whereby output is determined by supply side factors, such as investment, demographics, labour participation and productivity.

  • Dynamic Econometric Error Correction (DEEC) modelling combines VAR and DSE models by estimating the speed at which a dependent variable returns to its equilibrium after a shock, as well as assessing the impact of a company, industry, new technology, regulation, or market change. DEEC modelling is best suited for forecasting.

Forecasts of GDP growth per capita based on these factors can then be combined with demographic projections to give forecasts for overall GDP growth.
Wherever possible, publicly available data from official sources are used for the latest available year. Qualitative indicators are normalised (on the basis of: Normalised x = (x - Min(x)) / (Max(x) - Min(x)) where Min(x) and Max(x) are, the lowest and highest values for any given indicator respectively) and then aggregated across categories to enable an overall comparison. The normalised value is then transformed into a positive number on a scale of 0 to 100. The weighting assigned to each indicator can be changed to reflect different assumptions about their relative importance.

CLICK BELOW TO LEARN MORE
...

The principal explanatory variable in each industry’s output equation is the Total Demand variable, encompassing exogenous macroeconomic assumptions, consumer spending and investment, and intermediate demand for goods and services by sectors of the economy for use as inputs in the production of their own goods and services.

Elasticities
Elasticity measures the response of one economic variable to a change in another economic variable, whether the good or service is demanded as an input into a final product or whether it is the final product, and provides insight into the proportional impact of different economic actions and policy decisions.
Demand elasticities measure the change in the quantity demanded of a particular good or service as a result of changes to other economic variables, such as its own price, the price of competing or complementary goods and services, income levels, taxes.
Demand elasticities can be influenced by several factors. Each of these factors, along with the specific characteristics of the product, will interact to determine its overall responsiveness of demand to changes in prices and incomes.
The individual characteristics of a good or service will have an impact, but there are also a number of general factors that will typically affect the sensitivity of demand, such as the availability of substitutes, whereby the elasticity is typically higher the greater the number of available substitutes, as consumers can easily switch between different products.
The degree of necessity. Luxury products and habit forming ones, typically have a higher elasticity.
Proportion of the budget consumed by the item. Products that consume a large portion of the consumer’s budget tend to have greater elasticity.
Elasticities tend to be greater over the long run because consumers have more time to adjust their behaviour.
Finally, if the product or service is an input into a final product then the price elasticity will depend on the price elasticity of the final product, its cost share in the production costs, and the availability of substitutes for that good or service.

Prices
Prices are also forecast using an input-output framework. Input costs have two components; labour costs are driven by wages, while intermediate costs are computed as an input-output weighted aggregate of input sectors’ prices. Employment is a function of output and real sectoral wages, that are forecast as a function of whole economy growth in wages. Investment is forecast as a function of output and aggregate level business investment.

CLICK BELOW TO LEARN MORE
...