


Satellite Economy and Future Application Perspectives
Dr. Evangelo Damigos; PhD | Head of Digital Futures Research Desk
- Emerging Technologies
- Digital Transformation
Publication | Update: Nov 2022

The commercial satellite industry has overwhelmingly expanded. A record number of satellites were launched in the recent years. The cost of building and launching satellites fell while their utility improved all leading to greater affordability, better productivity and new markets. At the end of 2021, a total of 4,852 satellites orbited the Earth, a 179% increase over the past five years. The satellite industry dominated the global space industry, generating $ 386 billion in revenue - a 4% increase over 2020. The commercial satellite industry led the way, accounting for 72% of the global space business and 9 billion in total revenue. A record 1,713 commercial satellites were launched during the year, with 44% more commercially procured satellites deployed than in 2020, in part due to increased affordability. The global launch industry generated .7 billion in revenue.[1]
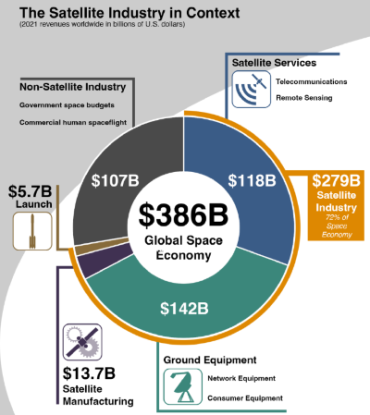
Figure 1 The satellite industry in context. SIA. (2022). State of the Satellite Industry Report. Retrieved from: https://sia.org/news-resources/state-of-the-satellite-industry-report/
With the alignment of Space and sustainability more investors are focusing on environment, social and governance factors. Satellite imagery provides key data on the environmental impact of a company’s activities. Satellite applications include monitoring greenhouse-gas emissions from companies and regions, helping utilities optimize renewable energy infrastructure and mining data to project how climate change could affect particular industries. The space industry now views private corporate participation in the sector favourably. While government agencies like NASA focus on ambitious missions like Mars exploration, private companies are focusing on low-Earth orbit transportation, satellite launches, and commercial human spaceflight. Space has become a more contested domain among countries, emphasizing the importance of "space domain awareness" among private and governmental players. Satellite providers see their services crossing political lines to address issues that matter to everyone, such as national security and bridging the digital divide. For a long time, companies in this industry attempted to capture the market by selling satellite, data, or technology, but customers could not understand how this related to their needs. Today, more and more providers in the industry are realizing that it is not about the data or technology, but rather it is about meeting the customer where they are and offering answers.[2]
Demand for space-based solutions is evolving rapidly and is shaped by several short- to long-term market trends, many of which were accelerated by the Covid 19 crisis. a whole new strategic and geopolitical dimension post-pandemic. The realities and weaknesses that the Covid 19 crisis revealed in Europe triggered serious concerns that shook political lines and sharpened Europe's focus on economic resilience, strategic autonomy and geopolitical power. In turn, these concerns have strengthened Europe's ambitions to become a more autonomous player in the digital economy, a leader in sustainable transformation and a security provider for its citizens that protects Europe's values and interests. Strategic stakes and policy developments in these areas, combined with the technological and socio-economic drivers already at play, will foster important market forces across all economic sectors in Europe. These trends will have a profound impact on downstream space markets, as satellites are in pole position to offer specific solutions for digital, environment and security-related markets. While the digital transformation, as mentioned earlier, certainly offers new market opportunities for space-based connectivity and data, it is also disrupting the mature satellite communications markets in which Europe has flourished. The growth of private investment is a great added value to public budgets and offers new opportunities to explore daring concepts, but it also influences the direction of public policy. The goal of encouraging private investment is now high on the agenda of European space policy. This is prompting public institutions to take on a new role in fostering the conditions for entrepreneurship and business development in the space sector.
It is now urgent that these conclusions are translated not only into new initiatives, but also into a coherent and consistent European strategy for downstream space applications. This complement to the current European strategy would make it possible to go beyond the logic of socio-economic benefits and address the new challenges with a coherent and integrated European approach and action, from space programmes to markets and from space systems to applications.[3]
[1] SIA. (2022). State of the Satellite Industry Report. Retrieved from: https://sia.org/news-resources/state-of-the-satellite-industry-report/
[2] Rani, G. (2021). Top 8 drivers in Space Economics. Space Economy Academy. Retrieved from: https://seac-space.com/top-8-drivers-in-space-economics/
[3] European Space Governance Initiative. (2022). The space downstream sector. Retrieved from: https://www.ifri.org/sites/default/files/atoms/files/moranta_space_downstream_sector_2022_.pdf
 Industry: Aerospace and Defense
 HTML
 Access Rights | Content Availability:


Objectives and Study Scope
This study has assimilated knowledge and insight from business and subject-matter experts, and from a broad spectrum of market initiatives. Building on this research, the objectives of this market research report is to provide actionable intelligence on opportunities alongside the market size of various segments, as well as fact-based information on key factors influencing the market- growth drivers, industry-specific challenges and other critical issues in terms of detailed analysis and impact.
The report in its entirety provides a comprehensive overview of the current global condition, as well as notable opportunities and challenges.
The analysis reflects market size, latest trends, growth drivers, threats, opportunities, as well as key market segments. The study addresses market dynamics in several geographic segments along with market analysis for the current market environment and future scenario over the forecast period.
The report also segments the market into various categories based on the product, end user, application, type, and region.
The report also studies various growth drivers and restraints impacting the market, plus a comprehensive market and vendor landscape in addition to a SWOT analysis of the key players.
This analysis also examines the competitive landscape within each market. Market factors are assessed by examining barriers to entry and market opportunities. Strategies adopted by key players including recent developments, new product launches, merger and acquisitions, and other insightful updates are provided.
Research Process & Methodology

We leverage extensive primary research, our contact database, knowledge of companies and industry relationships, patent and academic journal searches, and Institutes and University associate links to frame a strong visibility in the markets and technologies we cover.
We draw on available data sources and methods to profile developments. We use computerised data mining methods and analytical techniques, including cluster and regression modelling, to identify patterns from publicly available online information on enterprise web sites.
Historical, qualitative and quantitative information is obtained principally from confidential and proprietary sources, professional network, annual reports, investor relationship presentations, and expert interviews, about key factors, such as recent trends in industry performance and identify factors underlying those trends - drivers, restraints, opportunities, and challenges influencing the growth of the market, for both, the supply and demand sides.
In addition to our own desk research, various secondary sources, such as Hoovers, Dun & Bradstreet, Bloomberg BusinessWeek, Statista, are referred to identify key players in the industry, supply chain and market size, percentage shares, splits, and breakdowns into segments and subsegments with respect to individual growth trends, prospects, and contribution to the total market.
Research Portfolio Sources:
Global Business Reviews, Research Papers, Commentary & Strategy Reports
M&A and Risk Management | Regulation

The future outlook “forecast” is based on a set of statistical methods such as regression analysis, industry specific drivers as well as analyst evaluations, as well as analysis of the trends that influence economic outcomes and business decision making.
The Global Economic Model is covering the political environment, the macroeconomic environment, market opportunities, policy towards free enterprise and competition, policy towards foreign investment, foreign trade and exchange controls, taxes,
financing, the labour market and infrastructure.
We aim update our market forecast to include the latest market developments and trends.
Review of independent forecasts for the main macroeconomic variables by the following organizations provide a holistic overview of the range of alternative opinions:
As a result, the reported forecasts derive from different forecasters and may not represent the view of any one forecaster over the whole of the forecast period. These projections provide an indication of what is, in our view most likely to happen, not what it will definitely happen.
Short- and medium-term forecasts are based on a “demand-side” forecasting framework, under the assumption that supply adjusts to meet demand either directly through changes in output or through the depletion of inventories.
Long-term projections rely on a supply-side framework, in which output is determined by the availability of labour and capital equipment and the growth in productivity.
Long-term growth prospects, are impacted by factors including the workforce capabilities, the openness of the economy to trade, the legal framework, fiscal policy, the degree of government regulation.
Direct contribution to GDP
The method for calculating the direct contribution of an industry to GDP, is to measure its ‘gross value added’ (GVA); that is, to calculate the difference between the industry’s total pretax revenue and its total boughtin costs (costs excluding wages and salaries).
Forecasts of GDP growth: GDP = CN+IN+GS+NEX
GDP growth estimates take into account:

Market Quantification
All relevant markets are quantified utilizing revenue figures for the forecast period. The Compound Annual Growth Rate (CAGR) within each segment is used to measure growth and to extrapolate data when figures are not publicly available.
Revenues
Our market segments reflect major categories and subcategories of the global market, followed by an analysis of statistical data covering national spending and international trade relations and patterns. Market values reflect revenues paid by the final customer / end user to vendors and service providers either directly or through distribution channels, excluding VAT. Local currencies are converted to USD using the yearly average exchange rates of local currencies to the USD for the respective year as provided by the IMF World Economic Outlook Database.
Industry Life Cycle Market Phase
Market phase is determined using factors in the Industry Life Cycle model. The adapted market phase definitions are as follows:
The Global Economic Model
The Global Economic Model brings together macroeconomic and sectoral forecasts for quantifying the key relationships.
The model is a hybrid statistical model that uses macroeconomic variables and inter-industry linkages to forecast sectoral output. The model is used to forecast not just output, but prices, wages, employment and investment. The principal variables driving the industry model are the components of final demand, which directly or indirectly determine the demand facing each industry. However, other macroeconomic assumptions — in particular exchange rates, as well as world commodity prices — also enter into the equation, as well as other industry specific factors that have been or are expected to impact.
Forecasts of GDP growth per capita based on these factors can then be combined with demographic projections to give forecasts for overall GDP growth.
Wherever possible, publicly available data from official sources are used for the latest available year. Qualitative indicators are normalised (on the basis of: Normalised x = (x - Min(x)) / (Max(x) - Min(x)) where Min(x) and Max(x) are, the lowest and highest values for any given indicator respectively) and then aggregated across categories to enable an overall comparison. The normalised value is then transformed into a positive number on a scale of 0 to 100. The weighting assigned to each indicator can be changed to reflect different assumptions about their relative importance.

The principal explanatory variable in each industry’s output equation is the Total Demand variable, encompassing exogenous macroeconomic assumptions, consumer spending and investment, and intermediate demand for goods and services by sectors of the economy for use as inputs in the production of their own goods and services.
Elasticities
Elasticity measures the response of one economic variable to a change in another economic variable, whether the good or service is demanded as an input into a final product or whether it is the final product, and provides insight into the proportional impact of different economic actions and policy decisions.
Demand elasticities measure the change in the quantity demanded of a particular good or service as a result of changes to other economic variables, such as its own price, the price of competing or complementary goods and services, income levels, taxes.
Demand elasticities can be influenced by several factors. Each of these factors, along with the specific characteristics of the product, will interact to determine its overall responsiveness of demand to changes in prices and incomes.
The individual characteristics of a good or service will have an impact, but there are also a number of general factors that will typically affect the sensitivity of demand, such as the availability of substitutes, whereby the elasticity is typically higher the greater the number of available substitutes, as consumers can easily switch between different products.
The degree of necessity. Luxury products and habit forming ones, typically have a higher elasticity.
Proportion of the budget consumed by the item. Products that consume a large portion of the
consumer’s budget tend to have greater elasticity.
Elasticities tend to be greater over the long run because consumers have more time to adjust their behaviour.
Finally, if the product or service is an input into a final product then the price elasticity will depend on the price elasticity of the final product, its cost share in the production costs, and the availability of substitutes for that good or service.
Prices
Prices are also forecast using an input-output framework. Input costs have two components; labour costs are driven by wages, while intermediate costs are computed as an input-output weighted aggregate of input sectors’ prices. Employment is a function of output and real sectoral wages, that are forecast as a function of whole economy growth in wages. Investment is forecast as a function of output and aggregate level business investment.