...
...
Seven steps to boost IT business value and success! – Part...

...

Seven steps to boost IT business value and success! – Part...

Posted | Updated by Insights team:

Publication | Update:

Mar 2024
...

Smart city with speed line glowing light trail surround the city. big data connection technology concept, It business value
Image: ©Pratchaya | iStock

David P Jacobs, director of MaxVal Consultancy’s Business Value Maximisation Research and Development Programme, continues this two-part series on increasing business value, success and return on investment (ROI) from IT and digital transformation

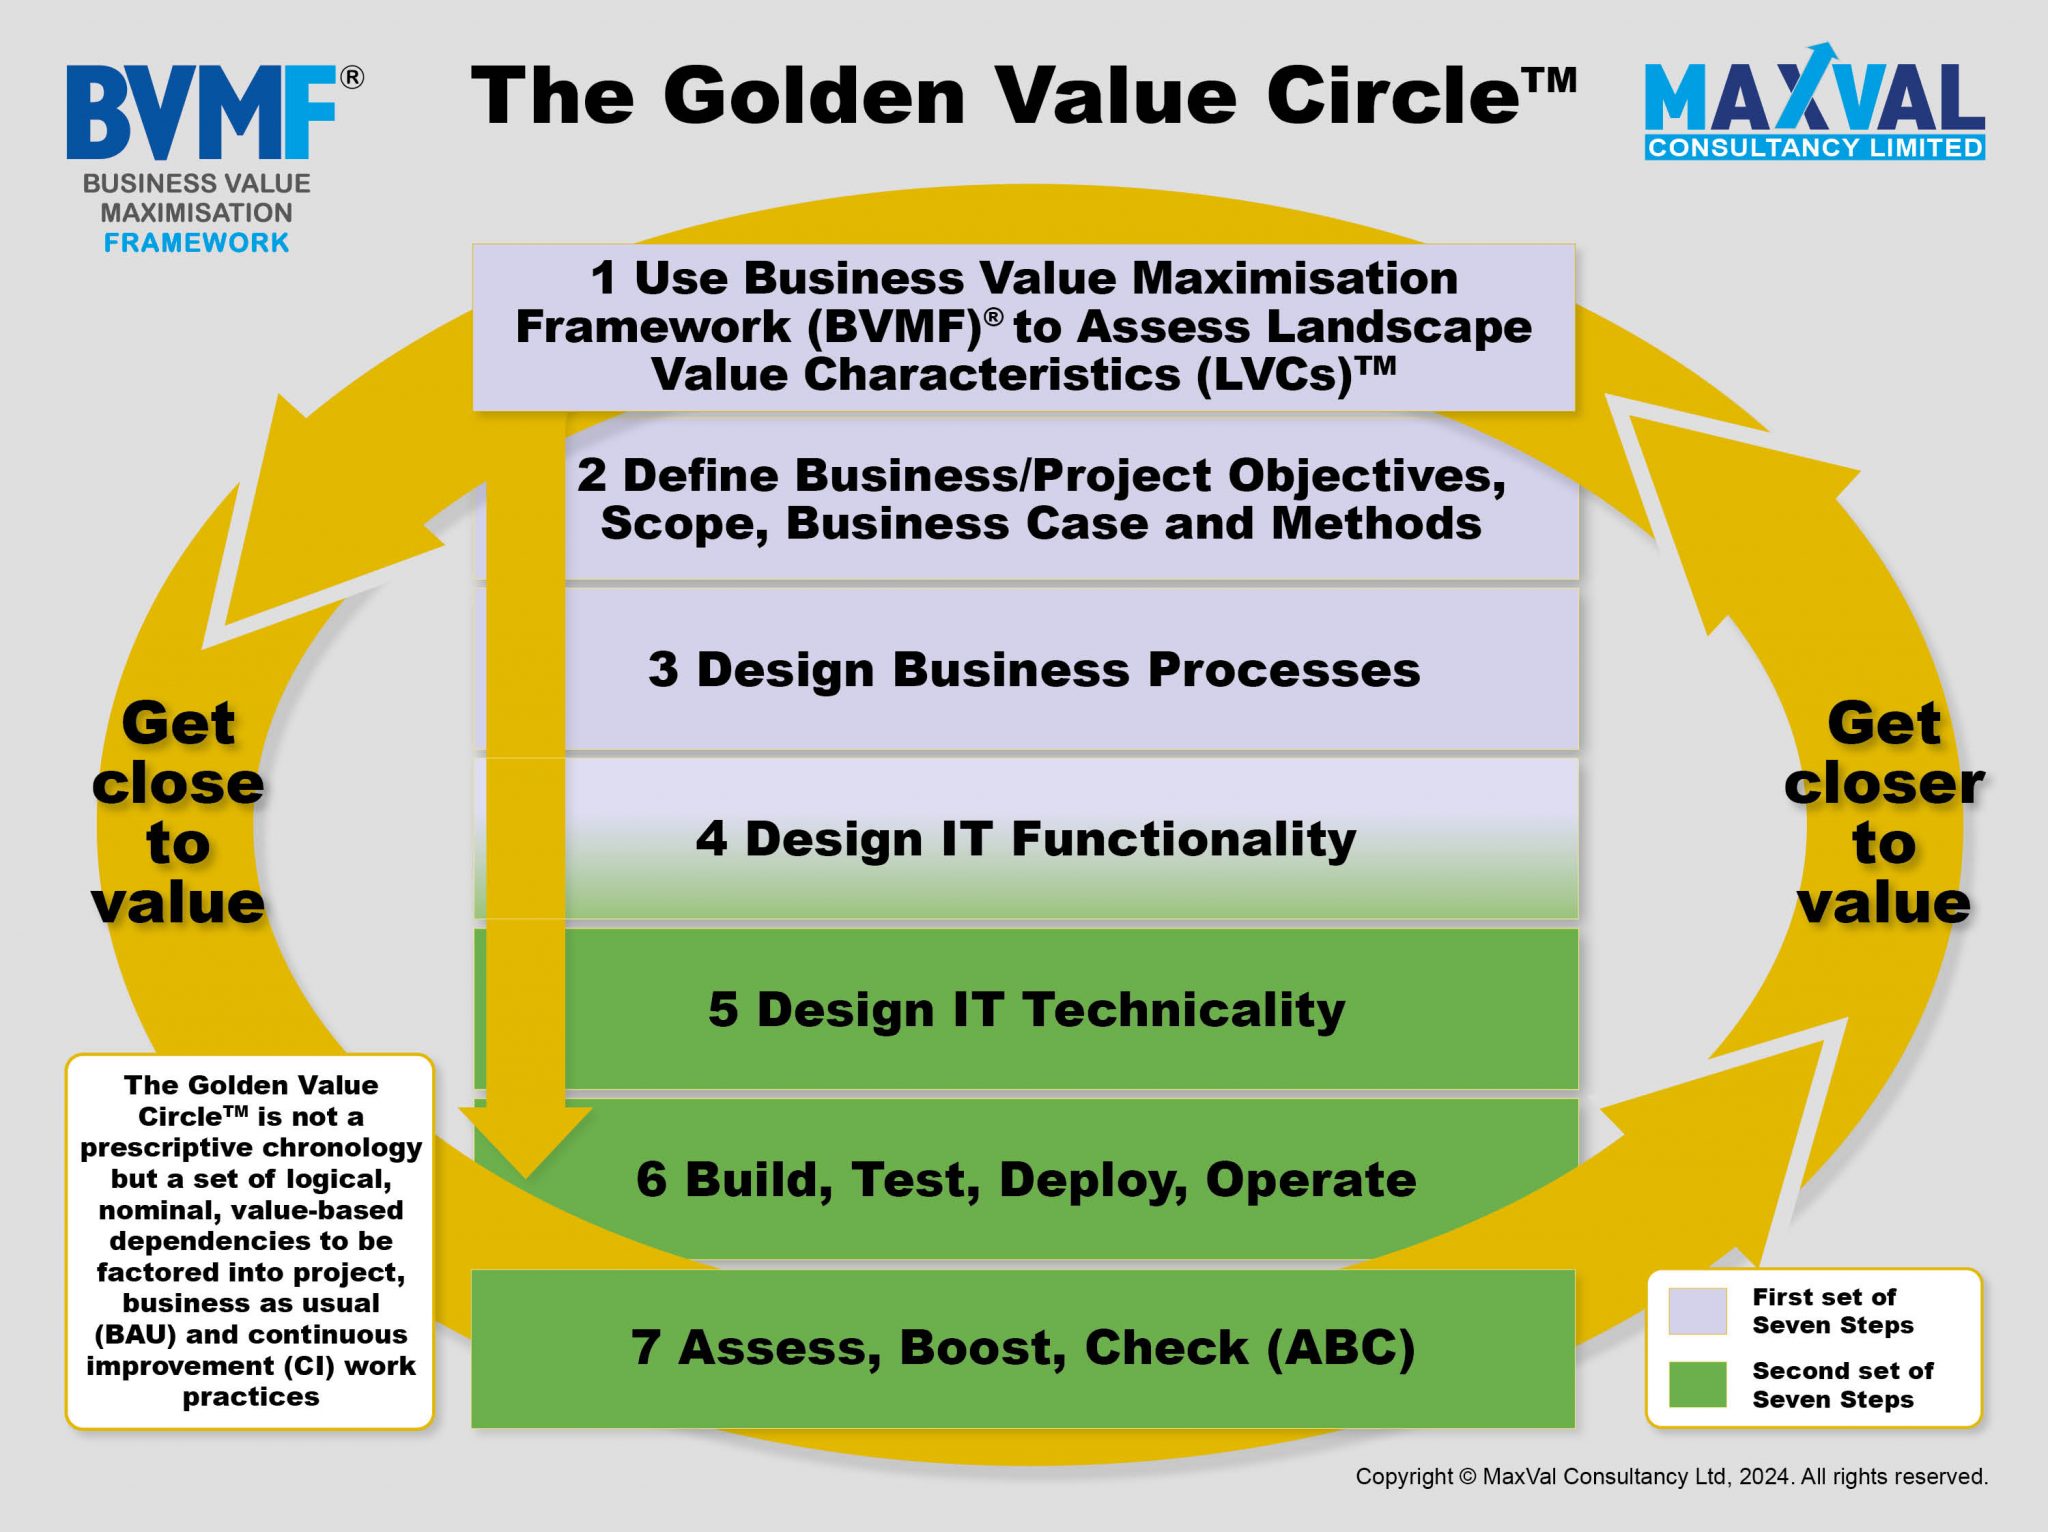
In part one, I covered the first four steps of the seven steps to boost IT business value encapsulated within The Golden Value Circle™. I now pick this up at step 4, Design IT Functionality, looking to give optimal power to business processes whose role it is to deliver the objectives defined in the previous step, Design Business Processes.

Design IT functionality

For IT functionality to boost business process performance optimally, its design must be driven by pre-optimised processes. Remember that IT functionality will facilitate a different, more centralised process. Then, incoming IT functionality can further boost this more centralised process with increased quality, speed and accuracy, providing certain key guidelines are followed so that humans and IT do what they are respectively good at.

MaxVal Consultancy uses several models from our Business Value Maximisation Framework (BVMF)® to carry out this important design. Computers and humans think and work differently. We emphasise these crucial differences in our Information Systems Activity/Role Spectrum™. Invariably, not enough consideration is given to these differences. Humans and IT functionality have to combine their respective (different) capabilities to enact a successful business process.

IT should carry out tasks it’s better at, and humans should do what they are good at, complementing each other into a powerful business process ‘team’. BVMF® models and techniques help take this down several levels into the micro aspects of team power optimisation (TPO), which we call Optimal Human-Computer Interaction (OH-CI)™. This is deeper, more fundamental than what used to be called HCI (Human-Computer interface), and more value-driven than whether the user can understand the icons on the screen! We do this business/IT business process ‘team’ optimisation at the macro and micro level, so the macro value conceived is not squandered at micro-implementation, which I see, sadly, so often.

...

Design IT technicality

Technical professionals, who have the most challenging job on the planet, sadly still don’t always recognise that IT technicality MUST work; often, it doesn’t. When IT systems are not performing optimally at run time, business processes are usually less effective and efficient than in the good old manual days, which I consider immoral, ineffective, and counterproductive.

Yes, IT can do wonderful things, but as a consumer or user, I often experience IT preventing me from doing my work! David Walliams said, “Computer Says No!” which was too bloomin’ true, as good comedy tends to be. We at MaxVal have devised a set of concepts, principles, guidelines and techniques (CPGTs) to optimise such situations.

These CPGTs make up BVMF®’s module Business Practice and Contingency (BP&C)™.

Build, test, deploy, operate

Dependently ‘next’, I suggest you build the IT functionality and the technicality that supports it and test it all together, ensuring you put as much effort into building your optimal business processes that combine human activity with IT functionality in the most powerful way as determined by the Optimal Human-Computer Interaction principles outlined above.

Once you have cut over to your new business processes and associated IT systems, monitor the manifestation of value closely in business as usual (BAU) operation and kick off a continuous improvement (CI) initiative straight away (no rest for the value-hungry) to boost value, success and ROI at regular intervals. Keep boosting value until there is little or no propensity to improve further – a situation most of us are unlikely ever to experience in our business IT project work. Still, it’s a great target to aim at!

Assess, boost, check

Thank goodness, more or less gone are the days when project teams would eventually get a new system live, often years late, celebrate over the weekend and return on Monday to start a new project. Achieving maximum business value requires constant vigilance and effort. Like electricity along a wire, value dissipates if not boosted over time and distance. It can even dissipate through the life of a project before going live, as it often did in the days when waterfall was thought to be the only way to proceed.

The modern iterative approach to IT development has certainly improved value potential in several respects, but only when used with the intelligence and focus I described in part one of this series. Purist agility can throw out as much of a baby’s bathwater as it brings in. Agile may be suitable for IT development, but it’s just one of several methods you must combine for a value-optimal project/piece of work. And do ask how well an agile approach to IT development integrates with the reality of your organisation’s management style and market.

So, once live with a minimum viable product (MVP) or whatever is the first live operation of the new processes/ systems, go back around the loop. Keep going around until the propensity to improve is exhausted. Continuous rounds of assessment, boosting and checking on value will supercharge your auto-assisted processes. We at MaxVal use BVMF®’s Crossword Diagram™ for this. Broadly, this helps break the business process domain down into addressable sub-processes/steps to assess how well each delivers against its objectives. We then split out any sub-standard sub-process/step into its component ingredients and determine whether the process, human users, IT functionality, IT technicality or something else is letting down the holistic delivery of value. The last stage is to fix the problems so the sub-process or step in question contributes more effectively to the value equation.

We also use our Business Value Equation (BVEq)™ to see how each value ingredient affects the others to target any ingredients not pulling their weight. Our module Business Practice and Contingency (BP&C)™ mentioned above is then brought into play to ensure any value designed during planning and development is manifesting at run time. Often, some decent improvement of business process and IT in the design steps doesn’t come through at run time due to a disconnect where such macro value is not properly supported at the micro executional level.

Sadly, too often, run time performance of IT technicality not only fails to support the power of the business processes via the IT functionality but actually degrades the functionality and consequently the business process, sometimes down to levels below where the business processes’ effectiveness and efficiency were before they were transformed! There are many ways to get this wrong and not many ways to get it right!

Good luck, you will get there.

Please Note: This is a Commercial Profile

More About Stakeholder

Contributor Profile

Client Support Manager
MaxVal Consultancy Ltd
Phone:+44 (0)7834 638373
Website: Visit Website

Contributor Profile

Chief Value Maximisation Specialist
MaxVal Consultancy Ltd
Phone:+44 (0)1932 248027
Website: Visit Website

...
Framed Content Aggregator - Publisher | Sponsor
...
OPEN ACCESS GOVERNMENT

Open Access Government is a digital publication that provides an in-depth perspective on key public policy areas from all around the world, including health and social care, research and innovation, technology, blockchain innovation, government, environment and energy. https://www.openaccessgovernment.org/

SKU code : 366CF303-B5D7-93E9-7714-E4C90014A099
Delivery Format:
HTML ...

Immediate Delivery
...Access Rights | Content Availability:
...

...

The content of this subscriber knowledge library area, the technology platform and tools are provided for information purposes only. No legal liability or other responsibility is accepted for any errors, omissions, or any loss, damage or inconvenience caused as a result of reliance on such information, or statements on this site, or any site to which these pages connect, since we cannot control the content or take responsibility for pages maintained by external providers. Where we provide links to sites, we do not by doing so endorse any information or opinions appearing in them. This courseware includes resources copyrighted and open educational resources (OER) by multiple individuals and organizations. If someone else is given access to your account login information, that person has read, understands and accepts the Conditions of Use for this platform.

...

Objectives and Study Scope

This study has assimilated knowledge and insight from business and subject-matter experts, and from a broad spectrum of market initiatives. Building on this research, the objectives of this market research report is to provide actionable intelligence on opportunities alongside the market size of various segments, as well as fact-based information on key factors influencing the market- growth drivers, industry-specific challenges and other critical issues in terms of detailed analysis and impact.

The report in its entirety provides a comprehensive overview of the current global condition, as well as notable opportunities and challenges. The analysis reflects market size, latest trends, growth drivers, threats, opportunities, as well as key market segments. The study addresses market dynamics in several geographic segments along with market analysis for the current market environment and future scenario over the forecast period. The report also segments the market into various categories based on the product, end user, application, type, and region.
The report also studies various growth drivers and restraints impacting the  market, plus a comprehensive market and vendor landscape in addition to a SWOT analysis of the key players.  This analysis also examines the competitive landscape within each market. Market factors are assessed by examining barriers to entry and market opportunities. Strategies adopted by key players including recent developments, new product launches, merger and acquisitions, and other insightful updates are provided.

Research Process & Methodology

...

We leverage extensive primary research, our contact database, knowledge of companies and industry relationships, patent and academic journal searches, and Institutes and University associate links to frame a strong visibility in the markets and technologies we cover.

We draw on available data sources and methods to profile developments. We use computerised data mining methods and analytical techniques, including cluster and regression modelling, to identify patterns from publicly available online information on enterprise web sites.
Historical, qualitative and quantitative information is obtained principally from confidential and proprietary sources, professional network, annual reports, investor relationship presentations, and expert interviews, about key factors, such as recent trends in industry performance and identify factors underlying those trends - drivers, restraints, opportunities, and challenges influencing the growth of the market, for both, the supply and demand sides.
In addition to our own desk research, various secondary sources, such as Hoovers, Dun & Bradstreet, Bloomberg BusinessWeek, Statista, are referred to identify key players in the industry, supply chain and market size, percentage shares, splits, and breakdowns into segments and subsegments with respect to individual growth trends, prospects, and contribution to the total market.

Research Portfolio Sources:

  • BBC Monitoring

  • BMI Research: Company Reports, Industry Reports, Special Reports, Industry Forecast Scenario

  • CIMB: Company Reports, Daily Market News, Economic Reports, Industry Reports, Strategy Reports, and Yearbooks

  • Dun & Bradstreet: Country Reports, Country Riskline Reports, Economic Indicators 5yr Forecast, and Industry Reports

  • EMIS: EMIS Insight and EMIS Dealwatch

  • Enerdata: Energy Data Set, Energy Market Report, Energy Prices, LNG Trade Data and World Refineries Data

  • Euromoney: China Law and Practice, Emerging Markets, International Tax Review, Latin Finance, Managing Intellectual Property, Petroleum Economist, Project Finance, and Euromoney Magazine

  • Euromonitor International: Industry Capsules, Local Company Profiles, Sector Capsules

  • Fitch Ratings: Criteria Reports, Outlook Report, Presale Report, Press Releases, Special Reports, Transition Default Study Report

  • FocusEconomics: Consensus Forecast Country Reports

  • Ken Research: Industry Reports, Regional Industry Reports and Global Industry Reports

  • MarketLine: Company Profiles and Industry Profiles

  • OECD: Economic Outlook, Economic Surveys, Energy Prices and Taxes, Main Economic Indicators, Main Science and Technology Indicators, National Accounts, Quarterly International Trade Statistics

  • Oxford Economics: Global Industry Forecasts, Country Economic Forecasts, Industry Forecast Data, and Monthly Industry Briefings

  • Progressive Digital Media: Industry Snapshots, News, Company Profiles, Energy Business Review

  • Project Syndicate: News Commentary

  • Technavio: Global Market Assessment Reports, Regional Market Assessment Reports, and Market Assessment Country Reports

  • The Economist Intelligence Unit: Country Summaries, Industry Briefings, Industry Reports and Industry Statistics

Global Business Reviews, Research Papers, Commentary & Strategy Reports

  • World Bank

  • World Trade Organization

  • The Financial Times

  • The Wall Street Journal

  • The Wall Street Transcript

  • Bloomberg

  • Standard & Poor’s Industry Surveys

  • Thomson Research

  • Thomson Street Events

  • Reuter 3000 Xtra

  • OneSource Business

  • Hoover’s

  • MGI

  • LSE

  • MIT

  • ERA

  • BBVA

  • IDC

  • IdExec

  • Moody’s

  • Factiva

  • Forrester Research

  • Computer Economics

  • Voice and Data

  • SIA / SSIR

  • Kiplinger Forecasts

  • Dialog PRO

  • LexisNexis

  • ISI Emerging Markets

  • McKinsey

  • Deloitte

  • Oliver Wyman

  • Faulkner Information Services

  • Accenture

  • Ipsos

  • Mintel

  • Statista

  • Bureau van Dijk’s Amadeus

  • EY

  • PwC

  • Berg Insight

  • ABI research

  • Pyramid Research

  • Gartner Group

  • Juniper Research

  • MarketsandMarkets

  • GSA

  • Frost and Sullivan Analysis

  • McKinsey Global Institute

  • European Mobile and Mobility Alliance

  • Open Europe

M&A and Risk Management | Regulation

  • Thomson Mergers & Acquisitions

  • MergerStat

  • Profound

  • DDAR

  • ISS Corporate Governance

  • BoardEx

  • Board Analyst

  • Securities Mosaic

  • Varonis

  • International Tax and Business Guides

  • CoreCompensation

  • CCH Research Network

...
Forecast methodology

The future outlook “forecast” is based on a set of statistical methods such as regression analysis, industry specific drivers as well as analyst evaluations, as well as analysis of the trends that influence economic outcomes and business decision making.
The Global Economic Model is covering the political environment, the macroeconomic environment, market opportunities, policy towards free enterprise and competition, policy towards foreign investment, foreign trade and exchange controls, taxes, financing, the labour market and infrastructure. We aim update our market forecast to include the latest market developments and trends.

Forecasts, Data modelling and indicator normalisation

Review of independent forecasts for the main macroeconomic variables by the following organizations provide a holistic overview of the range of alternative opinions:

  • Cambridge Econometrics (CE)

  • The Centre for Economic and Business Research (CEBR)

  • Experian Economics (EE)

  • Oxford Economics (OE)

As a result, the reported forecasts derive from different forecasters and may not represent the view of any one forecaster over the whole of the forecast period. These projections provide an indication of what is, in our view most likely to happen, not what it will definitely happen.

Short- and medium-term forecasts are based on a “demand-side” forecasting framework, under the assumption that supply adjusts to meet demand either directly through changes in output or through the depletion of inventories.
Long-term projections rely on a supply-side framework, in which output is determined by the availability of labour and capital equipment and the growth in productivity.
Long-term growth prospects, are impacted by factors including the workforce capabilities, the openness of the economy to trade, the legal framework, fiscal policy, the degree of government regulation.

Direct contribution to GDP
The method for calculating the direct contribution of an industry to GDP, is to measure its ‘gross value added’ (GVA); that is, to calculate the difference between the industry’s total pre­tax revenue and its total bought­in costs (costs excluding wages and salaries).

Forecasts of GDP growth: GDP = CN+IN+GS+NEX

GDP growth estimates take into account:

  • Consumption, expressed as a function of income, wealth, prices and interest rates;

  • Investment as a function of the return on capital and changes in capacity utilization; Government spending as a function of intervention initiatives and state of the economy;

  • Net exports as a function of global economic conditions.

CLICK BELOW TO LEARN MORE
...

Market Quantification
All relevant markets are quantified utilizing revenue figures for the forecast period. The Compound Annual Growth Rate (CAGR) within each segment is used to measure growth and to extrapolate data when figures are not publicly available.

Revenues

Our market segments reflect major categories and subcategories of the global market, followed by an analysis of statistical data covering national spending and international trade relations and patterns. Market values reflect revenues paid by the final customer / end user to vendors and service providers either directly or through distribution channels, excluding VAT. Local currencies are converted to USD using the yearly average exchange rates of local currencies to the USD for the respective year as provided by the IMF World Economic Outlook Database.

Industry Life Cycle Market Phase

Market phase is determined using factors in the Industry Life Cycle model. The adapted market phase definitions are as follows:

  • Nascent: New market need not yet determined; growth begins increasing toward end of cycle

  • Growth: Growth trajectory picks up; high growth rates

  • Mature: Typically fewer firms than growth phase, as dominant solutions continue to capture the majority of market share and market consolidation occurs, displaying lower growth rates that are typically on par with the general economy

  • Decline: Further market consolidation, rapidly declining growth rates

...

The Global Economic Model
The Global Economic Model brings together macroeconomic and sectoral forecasts for quantifying the key relationships.

The model is a hybrid statistical model that uses macroeconomic variables and inter-industry linkages to forecast sectoral output. The model is used to forecast not just output, but prices, wages, employment and investment. The principal variables driving the industry model are the components of final demand, which directly or indirectly determine the demand facing each industry. However, other macroeconomic assumptions — in particular exchange rates, as well as world commodity prices — also enter into the equation, as well as other industry specific factors that have been or are expected to impact.

  • Vector Auto Regression (VAR) statistical models capturing the linear interdependencies among multiple time series, are best used for short-term forecasting, whereby shocks to demand will generate economic cycles that can be influenced by fiscal and monetary policy.

  • Dynamic-Stochastic Equilibrium (DSE) models replicate the behaviour of the economy by analyzing the interaction of economic variables, whereby output is determined by supply side factors, such as investment, demographics, labour participation and productivity.

  • Dynamic Econometric Error Correction (DEEC) modelling combines VAR and DSE models by estimating the speed at which a dependent variable returns to its equilibrium after a shock, as well as assessing the impact of a company, industry, new technology, regulation, or market change. DEEC modelling is best suited for forecasting.

Forecasts of GDP growth per capita based on these factors can then be combined with demographic projections to give forecasts for overall GDP growth.
Wherever possible, publicly available data from official sources are used for the latest available year. Qualitative indicators are normalised (on the basis of: Normalised x = (x - Min(x)) / (Max(x) - Min(x)) where Min(x) and Max(x) are, the lowest and highest values for any given indicator respectively) and then aggregated across categories to enable an overall comparison. The normalised value is then transformed into a positive number on a scale of 0 to 100. The weighting assigned to each indicator can be changed to reflect different assumptions about their relative importance.

CLICK BELOW TO LEARN MORE
...

The principal explanatory variable in each industry’s output equation is the Total Demand variable, encompassing exogenous macroeconomic assumptions, consumer spending and investment, and intermediate demand for goods and services by sectors of the economy for use as inputs in the production of their own goods and services.

Elasticities
Elasticity measures the response of one economic variable to a change in another economic variable, whether the good or service is demanded as an input into a final product or whether it is the final product, and provides insight into the proportional impact of different economic actions and policy decisions.
Demand elasticities measure the change in the quantity demanded of a particular good or service as a result of changes to other economic variables, such as its own price, the price of competing or complementary goods and services, income levels, taxes.
Demand elasticities can be influenced by several factors. Each of these factors, along with the specific characteristics of the product, will interact to determine its overall responsiveness of demand to changes in prices and incomes.
The individual characteristics of a good or service will have an impact, but there are also a number of general factors that will typically affect the sensitivity of demand, such as the availability of substitutes, whereby the elasticity is typically higher the greater the number of available substitutes, as consumers can easily switch between different products.
The degree of necessity. Luxury products and habit forming ones, typically have a higher elasticity.
Proportion of the budget consumed by the item. Products that consume a large portion of the consumer’s budget tend to have greater elasticity.
Elasticities tend to be greater over the long run because consumers have more time to adjust their behaviour.
Finally, if the product or service is an input into a final product then the price elasticity will depend on the price elasticity of the final product, its cost share in the production costs, and the availability of substitutes for that good or service.

Prices
Prices are also forecast using an input-output framework. Input costs have two components; labour costs are driven by wages, while intermediate costs are computed as an input-output weighted aggregate of input sectors’ prices. Employment is a function of output and real sectoral wages, that are forecast as a function of whole economy growth in wages. Investment is forecast as a function of output and aggregate level business investment.

CLICK BELOW TO LEARN MORE
...